Feel free to download the bundle below!
The Code
#The purpose of this program is to analyze the relationship between the number of assets in a portfolio,
#and the average standard deviation of that portfolio. Users are promopted to choose between 5 different
#asset classes, but can also analyze custom data sets.
def Introduction():
#This function propts the user to enter a specified set of data. After user-entry,
# the function collects the corresponding data from their file locations, and returns
# the daily and monthly data.
choice = '?' #initiate choice
#print intro message
print("Hello. This program analyzes the relationship between the number of assets in a portfolio, and the average standard deviation of that portfolio.")
# Obtain User Input
choice = input("Please choose between the following asset classes to analyze:\n\nFor a representative sample of the stock market over the last 20 years, enter\033[1m 'SP500'\033[0m (This will use the oldest 400 securities in the S&P500). \nFor the 200 largest Exchange Traded Funds, diversified by asset class, enter\033[1m '200 ETFs'\033[0m.\nFor all of the ETFs traded on the Nasdaq that are at least 5 years old, enter\033[1m 'Nasdaq ETFs'\033[0m. *WARNING* This is an extremely large data set. Analysis is extremely CPU intensive and could take an extended period of time.\nFor a small-scale relationship analysis of only 3 ETFs, enter\033[1m '3 ETFs'\033[0m.\nFor the 200 largest Real Estate Investment Trusts, enter\033[1m 'REIT'\033[0m.\n")
#input validation
while choice != 'SP500' and choice != 'REIT' and choice != '200 ETFs' and choice != 'Nasdaq ETFs' and choice != '3 ETFs' and choice != 'Custom':
choice = input('Please make a valid selection. ')
#collect the corresponding files
if choice == 'SP500':
daily_data = 'SP 500 daily.txt'
monthly_data = 'SP 500 monthly.txt'
elif choice == 'REIT':
daily_data = 'REIT daily.txt'
monthly_data = 'REIT monthly.txt'
elif choice == '200 ETFs':
daily_data = '200 daily.txt'
monthly_data = '200 monthly.txt'
elif choice == 'Nasdaq ETFs':
daily_data = 'Nasdaq daily.txt'
monthly_data = 'Nasdaq monthly.txt'
elif choice == '3 ETFs':
daily_data = 'Three daily.txt'
monthly_data = 'Three monthly.txt'
elif choice == 'Custom':
daily_data = input('Enter filename for daily data: ')
monthly_data = input('Enter filename for monthly data: ')
print("processing...")
#return the data
return daily_data, monthly_data
def relationship_analysis(daily_data, monthly_data):
#This function does the bulk of the processing of the program. It takes the daily and monthly datasets
#and stores them in corresponding dictionaries. The daily return data is used to derive the correlations
#between each of the assets, and the monthly return data is used to derive the standard deviations
#and then convert the correlation matrix into a covariance matrix.
#It then propts the user for how many trials they would like to run for each possible value of stocks in
#the portfolio, and begins the simulation.
#For each trial, stocks are selected at random. For each set of trials for a given value
#of n, the calculated portfolio standard deviations are averaged and appended to the standard deviations
#list. After the simulation is finished, this list of average standard deviations for each value of n
#stocks is returned along with the list of generated x values.
#Initiate the daily data dictionary, d
#open the file with the daily data
three = open(daily_data, 'r')
d = dict()
titles = three.readline()
titles = titles.split('\t') #collect all the data titles to a list
#make each title the key for the data in the dictionary
for i in range(len(titles)):
titles[i] = titles[i].rstrip('\n')
d[titles[i]] = []
#Populate the dictionary
three = open(daily_data, 'r')
line_number = 0
length = len(three.readlines())
three = open(daily_data, 'r')
while line_number < length:
if line_number > 0:
line = three.readline().rstrip('\n').rstrip('%').split('\t')
number_in_list = 0
for item in d:
try:
d[item].append(float(line[number_in_list]))
number_in_list += 1
except:
d[item].append(line[number_in_list])
number_in_list += 1
line_number += 1
else:
three.readline()
line_number += 1
#format info for matrix
import numpy as np
matrix_input = []
for i in titles:
if i != 'Dates':
matrix_input.append(d[i])
#calculate matrix
comatrix = np.corrcoef(matrix_input)
########################################################################################################################
#Obtain the standard deviations for all of the assets
import statistics as stat #for standard deviation calculation
#initiate the monthly data dictionary, m
four = open(monthly_data, 'r')
m = dict()
titles = four.readline()
titles = titles.split('\t')
#set all the titles as keys in the dictionary
for i in range(len(titles)):
titles[i] = titles[i].rstrip('\n')
m[titles[i]] = []
#Populate the dictionary
four = open(monthly_data, 'r')
line_number = 0
length = len(four.readlines())
four = open(monthly_data, 'r')
while line_number < length:
if line_number > 0:
line = four.readline().rstrip('\n').rstrip('%').split('\t')
number_in_list = 0
for item in m:
try:
if line[number_in_list] != '#N/A N/A':
m[item].append(float(line[number_in_list]))
number_in_list += 1
elif line[number_in_list] == '#N/A N/A':
m[item].append(0)
number_in_list += 1
except: #for all the dates
m[item].append(line[number_in_list])
number_in_list += 1
line_number += 1
else:
four.readline()
line_number += 1
from statistics import stdev #to obtain all the standard deviations
import math #to use the square root function
#initiate dictionary to hold all of the standard deviations, s
s = m
count = 0
#delete the dates key
del s['Dates']
for key in s:
try:
if key != 'Dates':
s[key] = stdev(s[key]) * math.sqrt(12) / 100 #replace all of the lists with the annualized standard deviation of that list
except:
print("There was an error.")
###########################################################################################
#Covariance Matrix
from numpy import array
#initiate the covariance matrix
cvmatrix = array(list(comatrix))
stdvs = list(s.values()) #pop out all the standard deviations as a list
#convert the correlation between each two assets into a covariance by multiplying it by the standard deviation of each asset
for i in range(len(stdvs)):
cvmatrix[i] *= stdvs[i]
for x in range(len(stdvs)):
cvmatrix[i][x] *= stdvs[x]
###########################################################################################
#The Simulation
#Portfolio Standard Deviation
import random
#initiate lists
standard_deviations = []
iteration_average = []
#prompt for number of trials
print("Please enter the number of trials you would like to run for each number of assets. The more iterations per value of n, the more accurate the relationship will be, but the longer it will take to run. \nI suggest using smaller values for the larger data sets. Running the analysis on all Nasdaq ETFs with 10+ trials could take hundreds of hours to process on a high-performance computer.\n")
while True: #make sure input is valid, do not accept ValueErrors
try:
trials = int(input("Trials:"))
while trials < 1 or trials > 1000000000:
trials = int(input("Trials must be an integer between one and a billion. (Good luck running a billion trials without a supercomputer)\nTrials: "))
except ValueError:
print("Value must be an integer.")
else:
break #break if no error
print("Thank you. Analysis in progress, this may take a while...")
number_of_stocks_in_portfolio = []
#randomly select portfolio
picks = set()
for i in range(len(stdvs)): #this iterates for the total stock selection, once per portfolio stdv calculation
number_of_stocks_in_portfolio.append(i+1)
for z in range(trials):
while len(picks) <= i:
num = random.randrange(0,len(stdvs))
picks.add(num)
#at this point the picks for this number of assets are set
#Calc Standard Deviaiton for the random portfolio
terms = []
for n in picks:
for x in range(0,len(cvmatrix[n])):
if x in picks:
terms.append(cvmatrix[n][x])
#at this point all of the terms are in the terms list
#calculate the weight per asset, assuming an equally weighted portfolio
weights = 1/len(picks)
#weight each term and append to list
weighted_terms = []
for y in terms:
weighted_terms.append(y*(weights**2))
#calculate portfolio variance
variance = sum(weighted_terms)
#calculate portfolio standard deviation, *FOR THIS TRIAL AT THIS VALUE OF N STOCKS*
standard_deviation = math.sqrt(variance)
#add to list of all standard deviations for this value of n
iteration_average.append(standard_deviation)
#calculate the average standard deviation for this value of n stocks
average_for_trial = sum(iteration_average) / len(iteration_average)
#add the average standard deviation of n stocks to the list of all y values
standard_deviations.append(average_for_trial)
#reset iteration average to use for the next iteration of t trials for n stocks
iteration_average = []
return number_of_stocks_in_portfolio, standard_deviations # return x and y variables
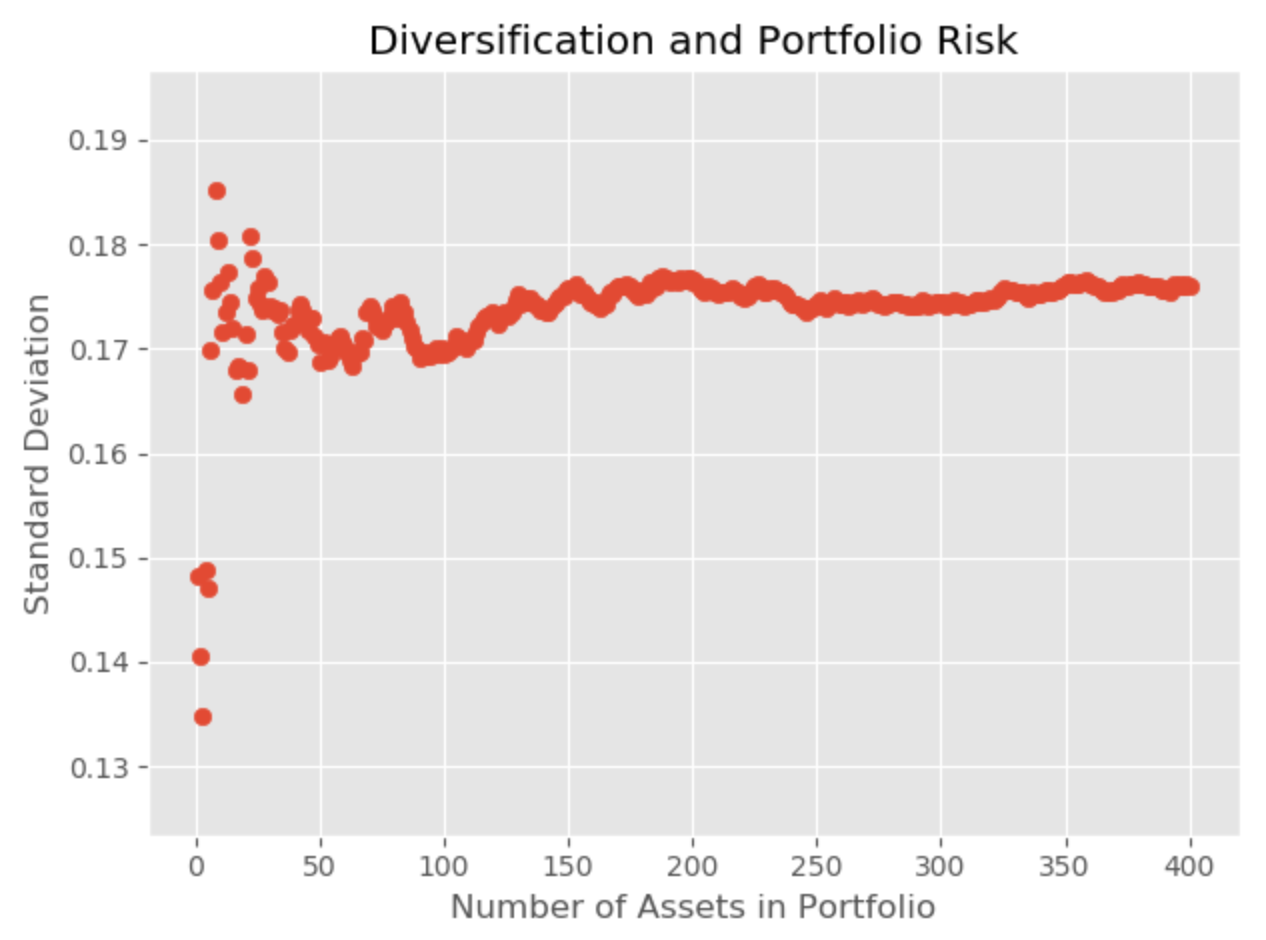
def graph_results(number_of_stocks_in_portfolio, standard_deviations):
#This function takes the x and y values as parameters, and creates a scatterplot of the data
#import packages
import matplotlib
import matplotlib.pyplot as plt
matplotlib.style.use('ggplot')
plt.ylabel('Standard Deviation')
plt.xlabel('Number of Assets in Portfolio')
plt.title('Diversification and Portfolio Risk')
plt.scatter(number_of_stocks_in_portfolio, standard_deviations) # send data to function
plt.show() #show the plot
def main():
#This function calles the introduction function, makes sure that all custom files exist, and then
#calls the relationship analysis function, and graph results function. After the analysis is complete,
#the user is notified.
#call the intro
daily_data, monthly_data = Introduction()
while True: #validate files for Custom entries
try:
three = open(daily_data, 'r')
four = open(monthly_data, 'r')
except FileNotFoundError: #do not accept files that don't exist
print("Make sure you have the correct filenames for custom entries. ")
daily_data = input('Enter filename for daily data: ')
monthly_data = input('Enter filename for monthly data: ')
else:
break
try: #try suite
number_of_stocks_in_portfolio, standard_deviations = relationship_analysis(daily_data, monthly_data)
graph_results(number_of_stocks_in_portfolio,standard_deviations)
print("Analysis complete.")
except Exception: # catch exceptions for bad data
print("Make sure custom data is correctly formatted.")
main()
Python
Sample Output