
Tristan Lalor
Preface
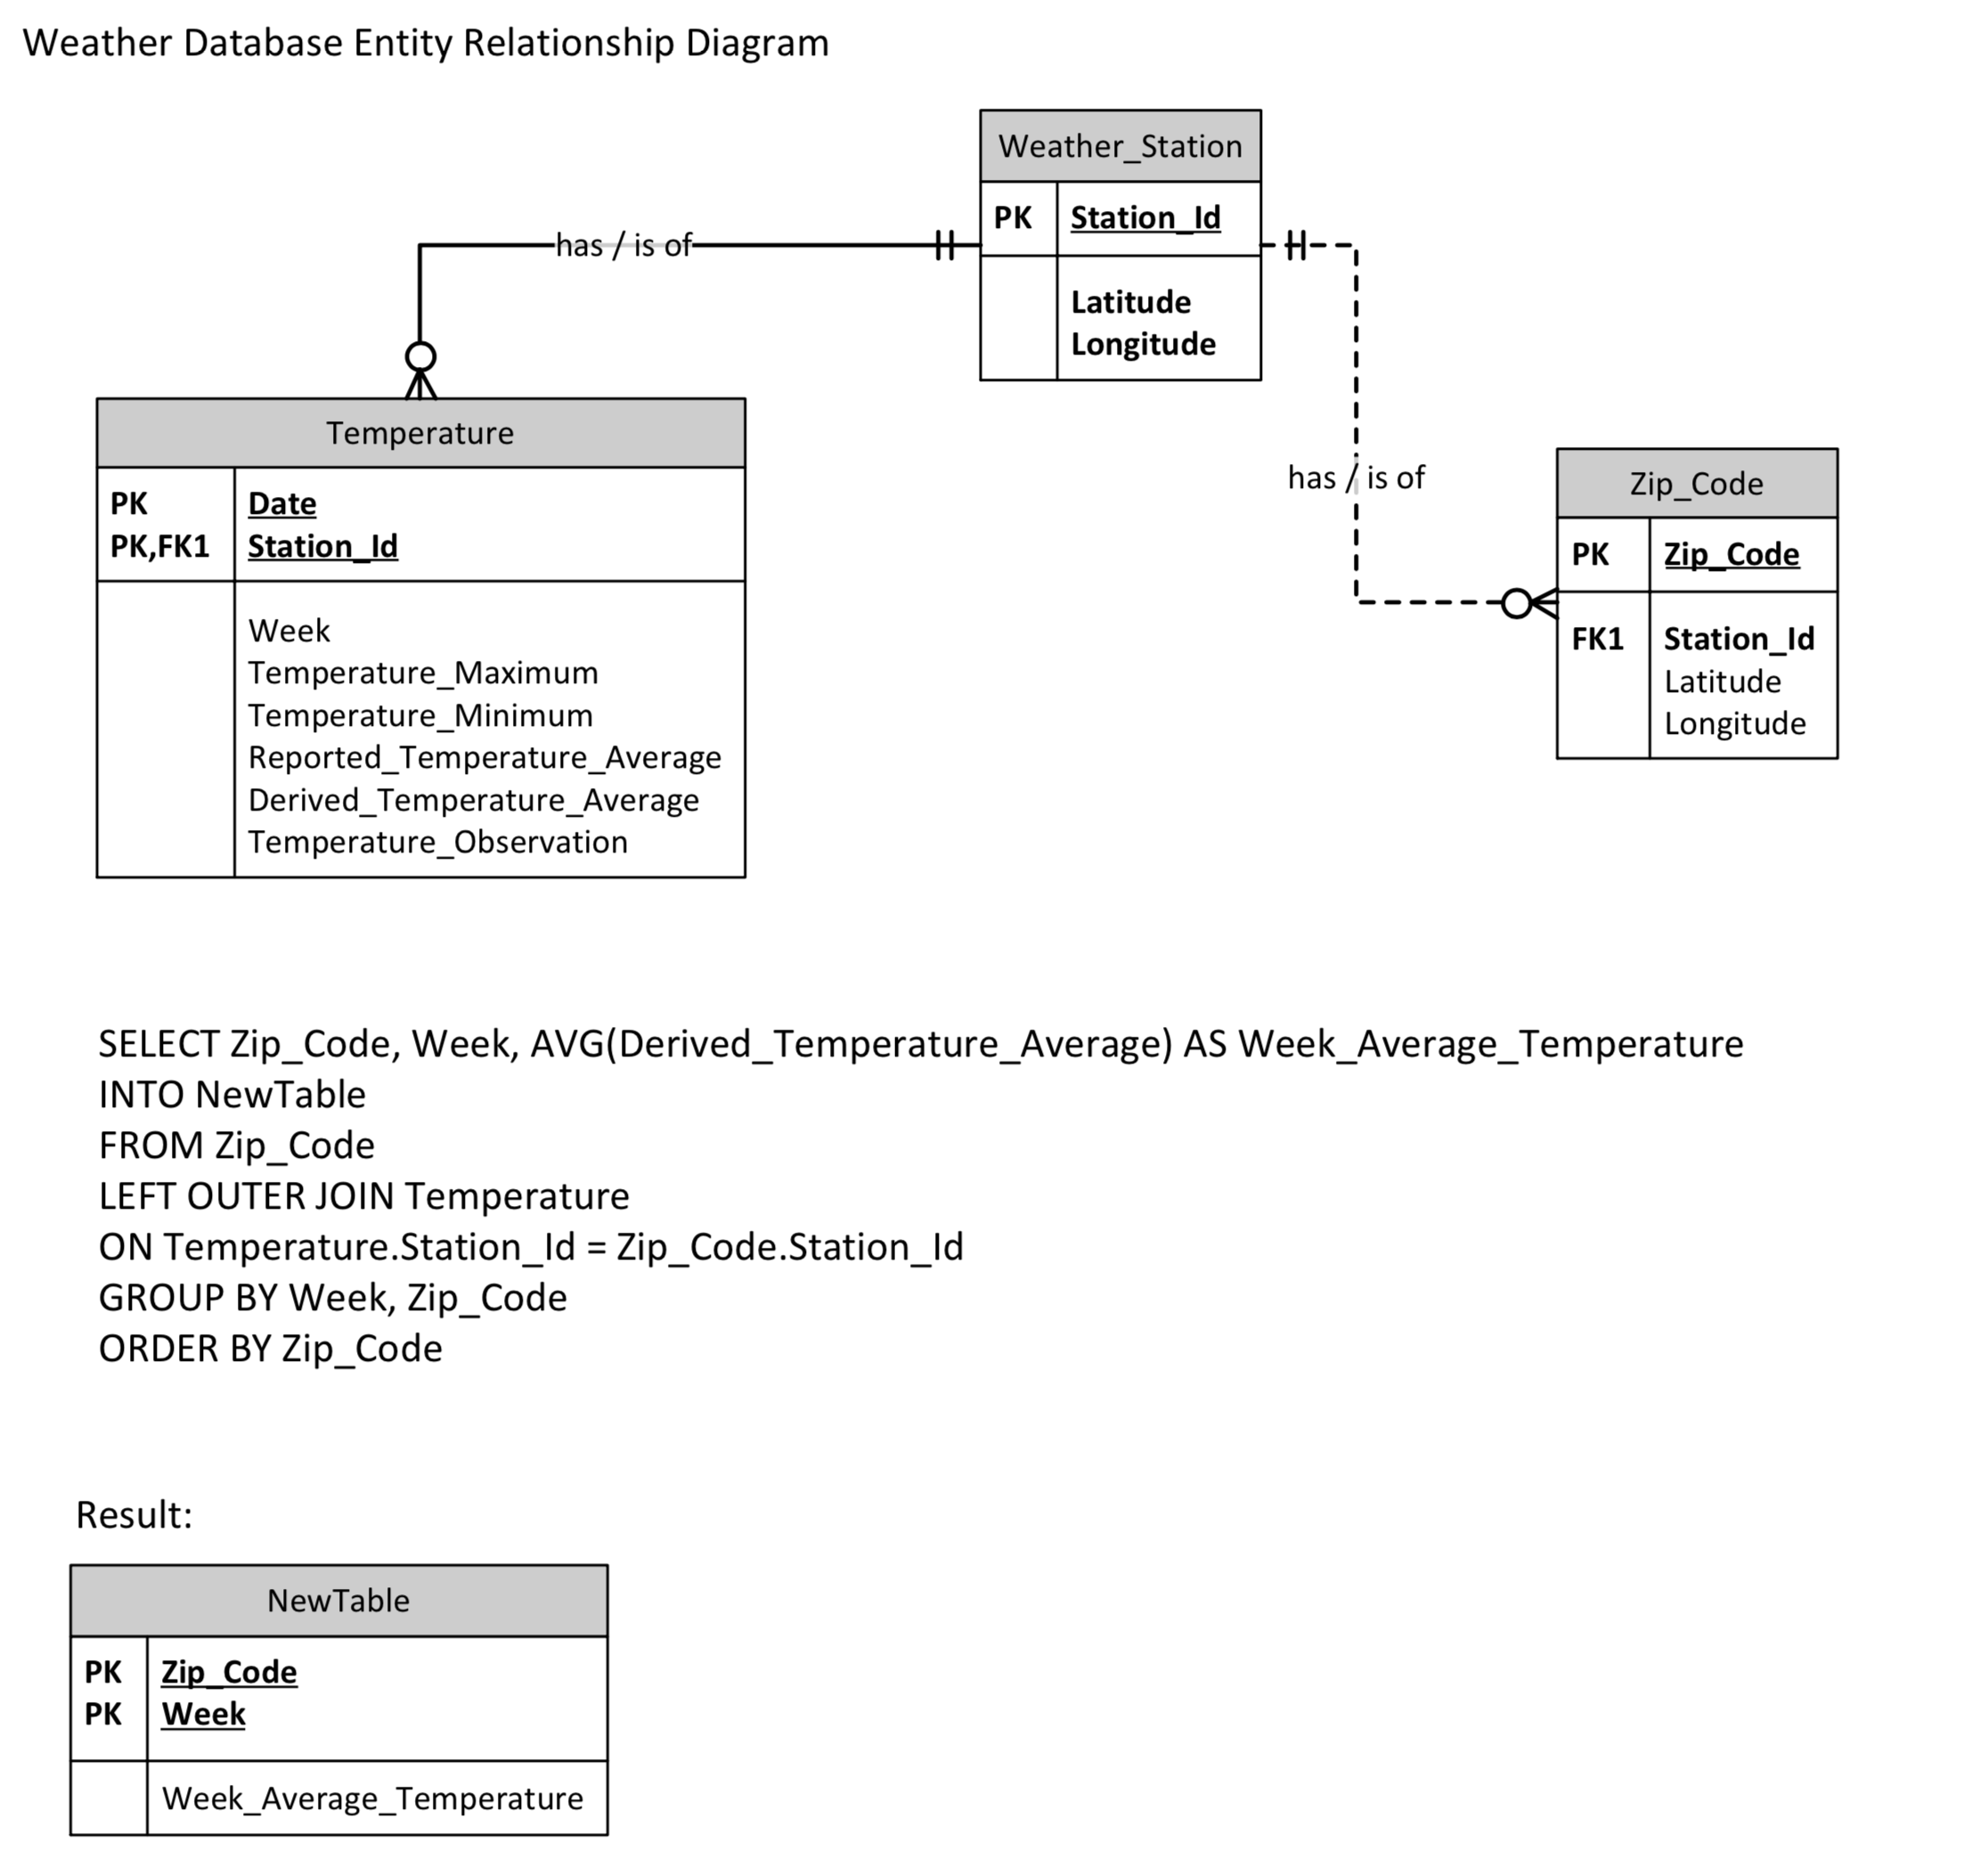
I was tasked with creating a system for assessing temperature by zip-code for every zip-code in the US, based on the last several years of temperature patterns. The way that I determined to be most efficient was to create a database that would allow the user to query average temperatures for certain regions in a certain timeframe. Based on the availability of data, this is the schema I designed for the database:
The first step of this process was finding data to use. After much research looking into the best sources for US temperature data, I ended up using bulk NOAA datasets from the Daily Global Historical Climatology Network (GHCN-DAILY). The data was only accessible in the form of hundreds of separate million-line CSVs containing all types of weather data from all throughout the world in the following format:
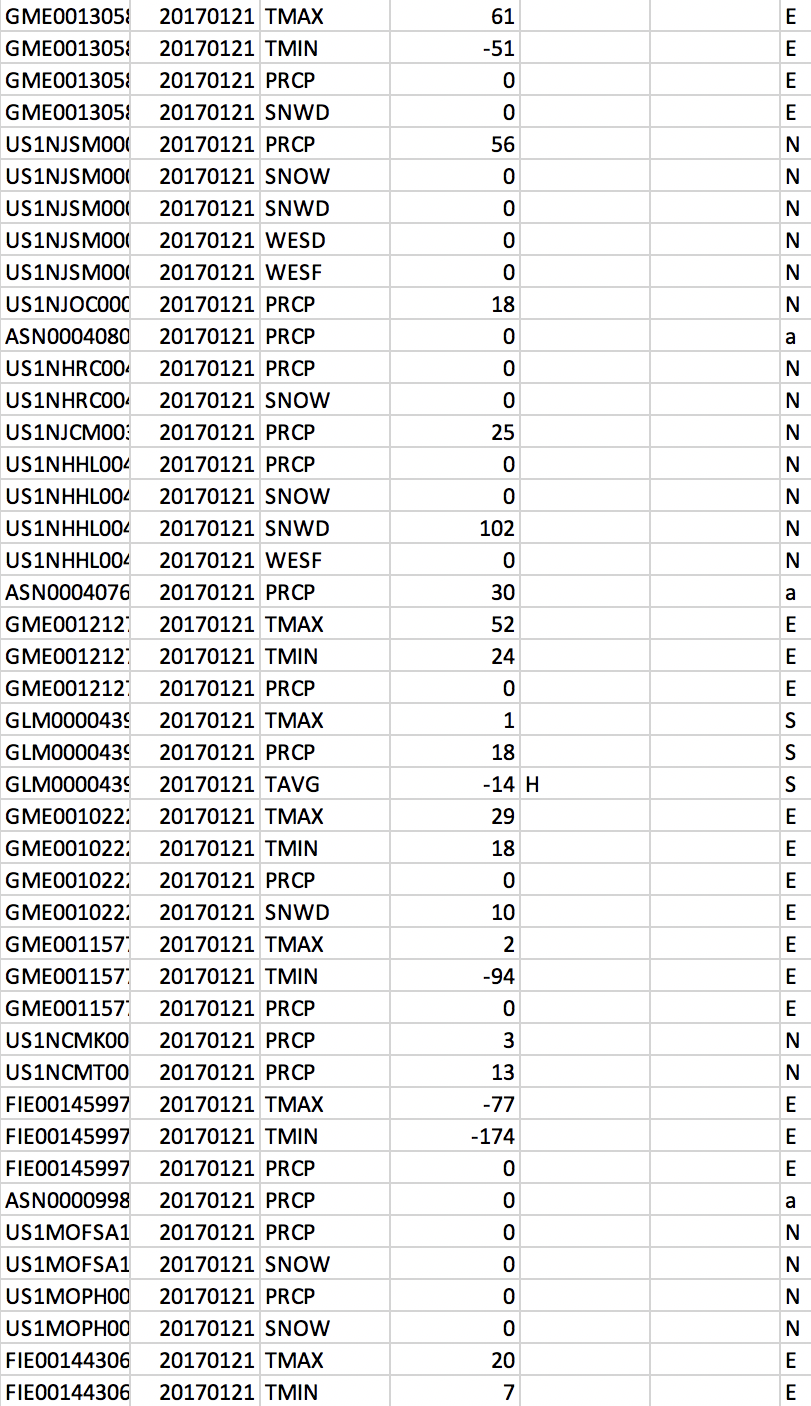
Not ideal, but it would work.
The next thing I had to do was to find which zip-code corresponded with each weather station. I was able to access a separate file containing the coordinates of each weather station, which I could then cross reference with the coordinates of each zip-code. As it turns out, there was not a weather station in every zip code, so I had to write an algorithm using python to match each zip-code to it's closest weather station.
Pairing Algorithm
from progressbar import ProgressBar
pbar = ProgressBar()
import os.path
import pandas as pd
import numpy as np
import math as m
def readcsv(filename):
data = pd.read_csv(filename, dtype=str)
return(np.array(data))
#Obtain Tables
Stationslist = readcsv("Datatables/Active_Weather_Stations.csv")
Zip_Codes = readcsv("Datatables/Zip_Codes_Full.csv")
#establish a stations dictionary with values of [lat, long] lists
station_location_dict = dict()
for row in Stationslist:
station_location_dict[row[0]] = [row[1], row[2]]
#establish a zip codes dictionary with values of [lat, long] lists
zip_code_location_dict = dict()
for row in Zip_Codes:
zip_code_location_dict[row[0]] = [row[3],row[4]]
#Pair EACH zipcode with the station id that has the smallest abs((actual_lat - trial_lat)) + abs((actual_lon - trial_lon))
key = list(zip_code_location_dict.keys())
for zip_code in pbar(list(zip_code_location_dict.keys())):
discrepency = 1000000
closest_station = 'null'
actual_lat = float(zip_code_location_dict.get(zip_code)[0])
actual_lon = float(zip_code_location_dict.get(zip_code)[1])
for station_id in station_location_dict.keys():
trial_lat = float(station_location_dict.get(station_id)[0])
trial_lon = float(station_location_dict.get(station_id)[1])
trial_discrepency = m.sqrt((actual_lat-trial_lat)**2+(actual_lon-trial_lon)**2)
if trial_discrepency < discrepency:
discrepency = trial_discrepency
closest_station = station_id
new_data = zip_code_location_dict.get(zip_code)
new_data.append(closest_station)
zip_code_location_dict[zip_code] = new_data
new_column = []
for row in Zip_Codes:
new_column.append(zip_code_location_dict.get(row[0])[2])
print(len(set(new_column)))
new_column = np.array(new_column).reshape(-1,1)
Zip_Codes = np.hstack((Zip_Codes, new_column))
Headers = np.array(['Zip_Code', 'City', 'State', 'Latitude', 'Longitude', 'Timezone', 'Daylight_Savings_Time_Flag', 'Station_Id'])
Zip_Codes = np.vstack((Headers, Zip_Codes))
np.savetxt("Datatables/Full_Zip_Codes_w_FKeys.csv", Zip_Codes.astype(np.str), fmt='%s', delimiter=",")
Python
Each zip code was paired with its nearest weather station by finding the minimum distance between the coordinates of the zip code and the coordinates of the weather station.
The weather stations being paired to the zip codes are a selection of only the active stations for which we have data.
In order to find optimal values in situations like this, it is common to use a discrepancy tolerance (2 degrees for instance) and return the first value that is within the tolerance. This method is useful because it works quickly and will not pair any values that are outside of the set tolerance. However, for our purposes, I found the absolute minima for each iteration, which while being more CPU intensive, yields more accurate results and ensures that each value has a pair.
For each of the 43,192 zip codes, the program ran through all active weather stations and paired the zip code with its corresponding weather station that minimizes coordinate discrepancy.
Discrepancy is calculated as:

where the actuals are the coordinates of the zip code and the trials are the coordinates of the trial weather stations.
Therefore, these 7,895 or so daily data points are extrapolated to all of the 43,192 zip codes when outer joined with SQL, with each weather station representing 5.47 zip codes on average.
Now to take a closer look at how I dealt with the mass of unorganized weather data. The attached python script shows how I collected the data from each file, sorted out irrelevant station IDs (non-US), extracted only relevant fields (temperature max, min, and average), calculated week numbers based on the date, and restructured the data to be normal and consistent with the schema I designed.
Data Structuring
from progressbar import ProgressBar
pbar = ProgressBar()
import numpy as np
import pandas as pd
def readcsv(filename):
data = pd.read_csv(filename) #Please add four spaces here before this line
return(np.array(data)) #Please add four spaces here before this line
import os.path
import pandas as pd
import numpy as np
from string import ascii_uppercase
from string import ascii_lowercase
def generate_filenames():
ups = []
for letter in ascii_uppercase:
item = "X" + "A" + letter
ups.append(item)
for letter in ascii_uppercase:
item = "X" + "B" + letter
ups.append(item)
lows = []
for letter in ascii_lowercase:
item = "x" + "a" + letter
lows.append(item)
for letter in ascii_lowercase:
item = "x" + "b" + letter
lows.append(item)
other = []
for letter in ascii_lowercase:
other.append(letter)
return other + ups + lows
y = generate_filenames()
count = 0
for year in(2015, 2016, 2017, 2018):
for xxx in y:
filename = "Files/"+str(year)+"/Raw/"+xxx+".csv"
if os.path.isfile(filename):
Secondary_Array = readcsv(filename)
if count == 0:
Master_Array = Secondary_Array[:,:5]
else:
Master_Array = np.concatenate((Master_Array, Secondary_Array[:,:5]))
count += 1
#save progress
import pickle
with open("Master_Array.txt", "wb") as fp: #Pickling
pickle.dump(Master_Array, fp)
import pickle
with open("Master_Array.txt", "rb") as fp: # Unpickling
Master_Array = pickle.load(fp)
new_column = Master_Array[:,0]
array_form = ([])
for i in new_column:
array_form.append([i[:2]])
array_form = np.asarray(array_form)
Master_Array = np.append(Master_Array, array_form, axis=1)
US_Array = np.empty((1,6))
US_Array = np.vstack((US_Array, Master_Array[Master_Array[:,5] == "US"])) #this is the most powerful line of code ever written
Temperature_column = US_Array[:,2]
array_form = ([])
for i in Temperature_column:
array_form.append([str(i)[:1]])
array_form = np.asarray(array_form)
US_Array = np.append(US_Array, array_form, axis=1)
SORTED = np.empty((1,7))
SORTED = np.vstack((SORTED, US_Array[US_Array[:,6] == "T"]))
#save progress
np.savetxt("Datatables/Temperature_Table.csv", SORTED.astype(np.str), fmt='%s', delimiter=",")
Temperature_Table = readcsv("Datatables/Temperature_Table.csv")
tempdict = dict()
#first run through
for row in Temperature_Table[1:,:]:
tempdict[(row[0], row[1])] = [None,None,None,None]
#2nd run through
for row in Temperature_Table[1:,:]:
if row[2] == 'TMAX':
tempdict[(row[0], row[1])][0] = row[3]
elif row[2] == 'TMIN':
tempdict[(row[0], row[1])][1] = row[3]
elif row[2] == 'TOBS':
tempdict[(row[0], row[1])][2] = row[3]
elif row[2] == 'TAVG':
tempdict[(row[0], row[1])][3] = row[3]
for key in tempdict.keys():
if tempdict[key][0] != None and tempdict[key][1] != None:
tempdict[key].append((float(tempdict[key][0])+float(tempdict[key][1]))/2)
else:
tempdict[key].append(None)
Temperature_Table_Normal = [['Station Id','Date', 'TMAX', 'TMIN', 'TOBS', 'TAVG - Reported', 'TAVG - Calculated']]
for key in pbar(list(tempdict.keys())[:]):
Temperature_Table_Normal.append([key[0], key[1], tempdict[key][0],tempdict[key][1],tempdict[key][2],tempdict[key][3],tempdict[key][4]])
import datetime
new_column = ['Week']
for row in Temperature_Table_Normal:
if row[0] != 'Station Id':
week = datetime.date(int(float(str(row[1])[:4])),int(float(str(row[1])[4:6])),int(float(str(row[1])[6:]))).isocalendar()[1]
new_column.append(week)
Temperature_Table_Normal = np.array(Temperature_Table_Normal)
new_column = np.array(new_column).reshape(-1,1)
Temperature_Table_Normal = np.hstack((Temperature_Table_Normal, new_column))
np.savetxt("Datatables/Temperature_Table_Normal(From a List).csv", Temperature_Table_Normal.astype(np.str), fmt='%s', delimiter=",")
Python
There are a total of 8,519,230 unique temperature data points across 1,079 days, with an average of 7,895 data points per day. After completion of all the scripts, the data was output into 3 final data tables to be loaded into SSMS.
This project took a long time from start to finish but I'm glad I could walk away with a finished and usable product. Reach out if you have any questions!
Tristan