Below are 4 models that consistent of different asset data. These models assess the standard deviation of each security based on daily return data, create correlation and covariance matrices, and calculate portfolio expected return and variance / standard deviation based on varying weights of each asset. By defining constraints as a non-linear optimization model, we are able to solve for the optimal mix of securities to either maximize return given a minimum portfolio standard deviation, or minimize risk given a required return.
The four models are broken down as follows:
1.
200 Exchange Traded Funds - solved
runtime: 26.2 hours
2.
24 Exchange Traded Funds - solved
runtime: 36 minutes
3.
200 Real Estate Investment Trust Funds - solved
runtime: 22.1 hours
4.
All NASDAQ ETFs (1277 Securities) - unsolved → Feel free to run this on a super computer...
runtime: —
Here's a look at the 200 ETF Model. The data in input into the top-left section of the worksheet, and all of the the following fields will calculate automatically. The matrices are dynamic, so this model can be used on any number of securities over any historical timeframe.
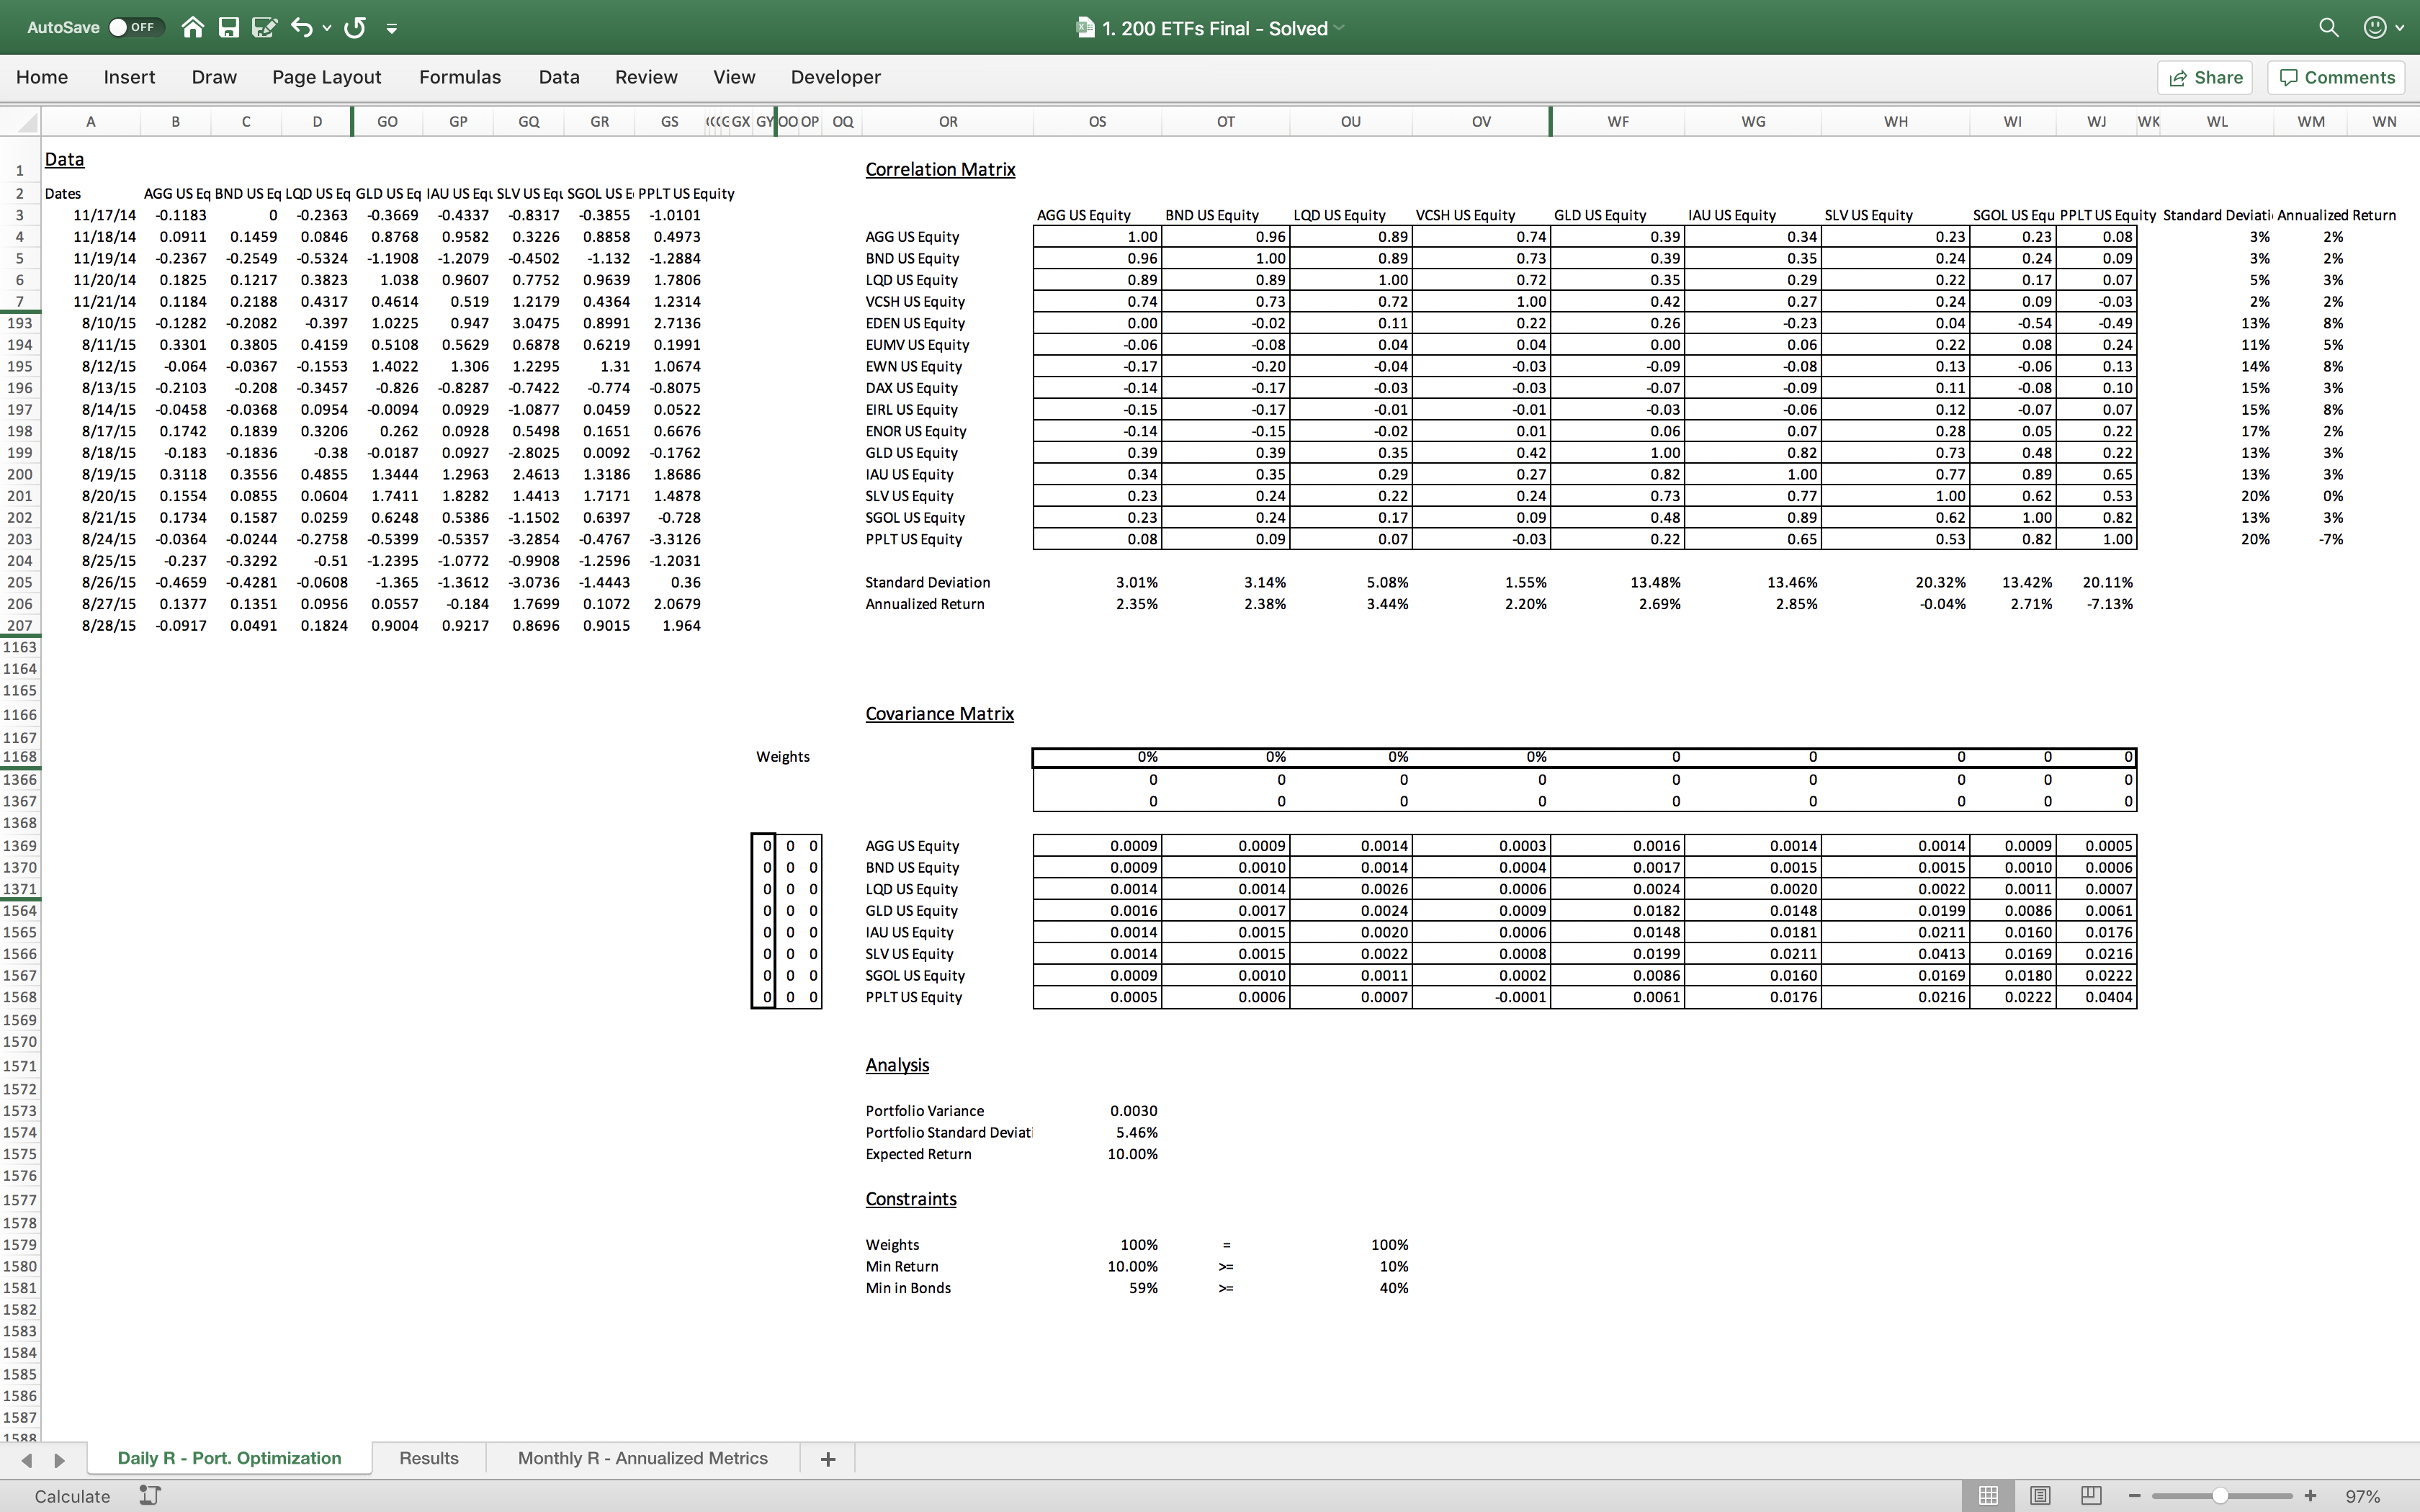
Note: there are thousands of cells hidden to simplify the model.
Feel free to download the files below!
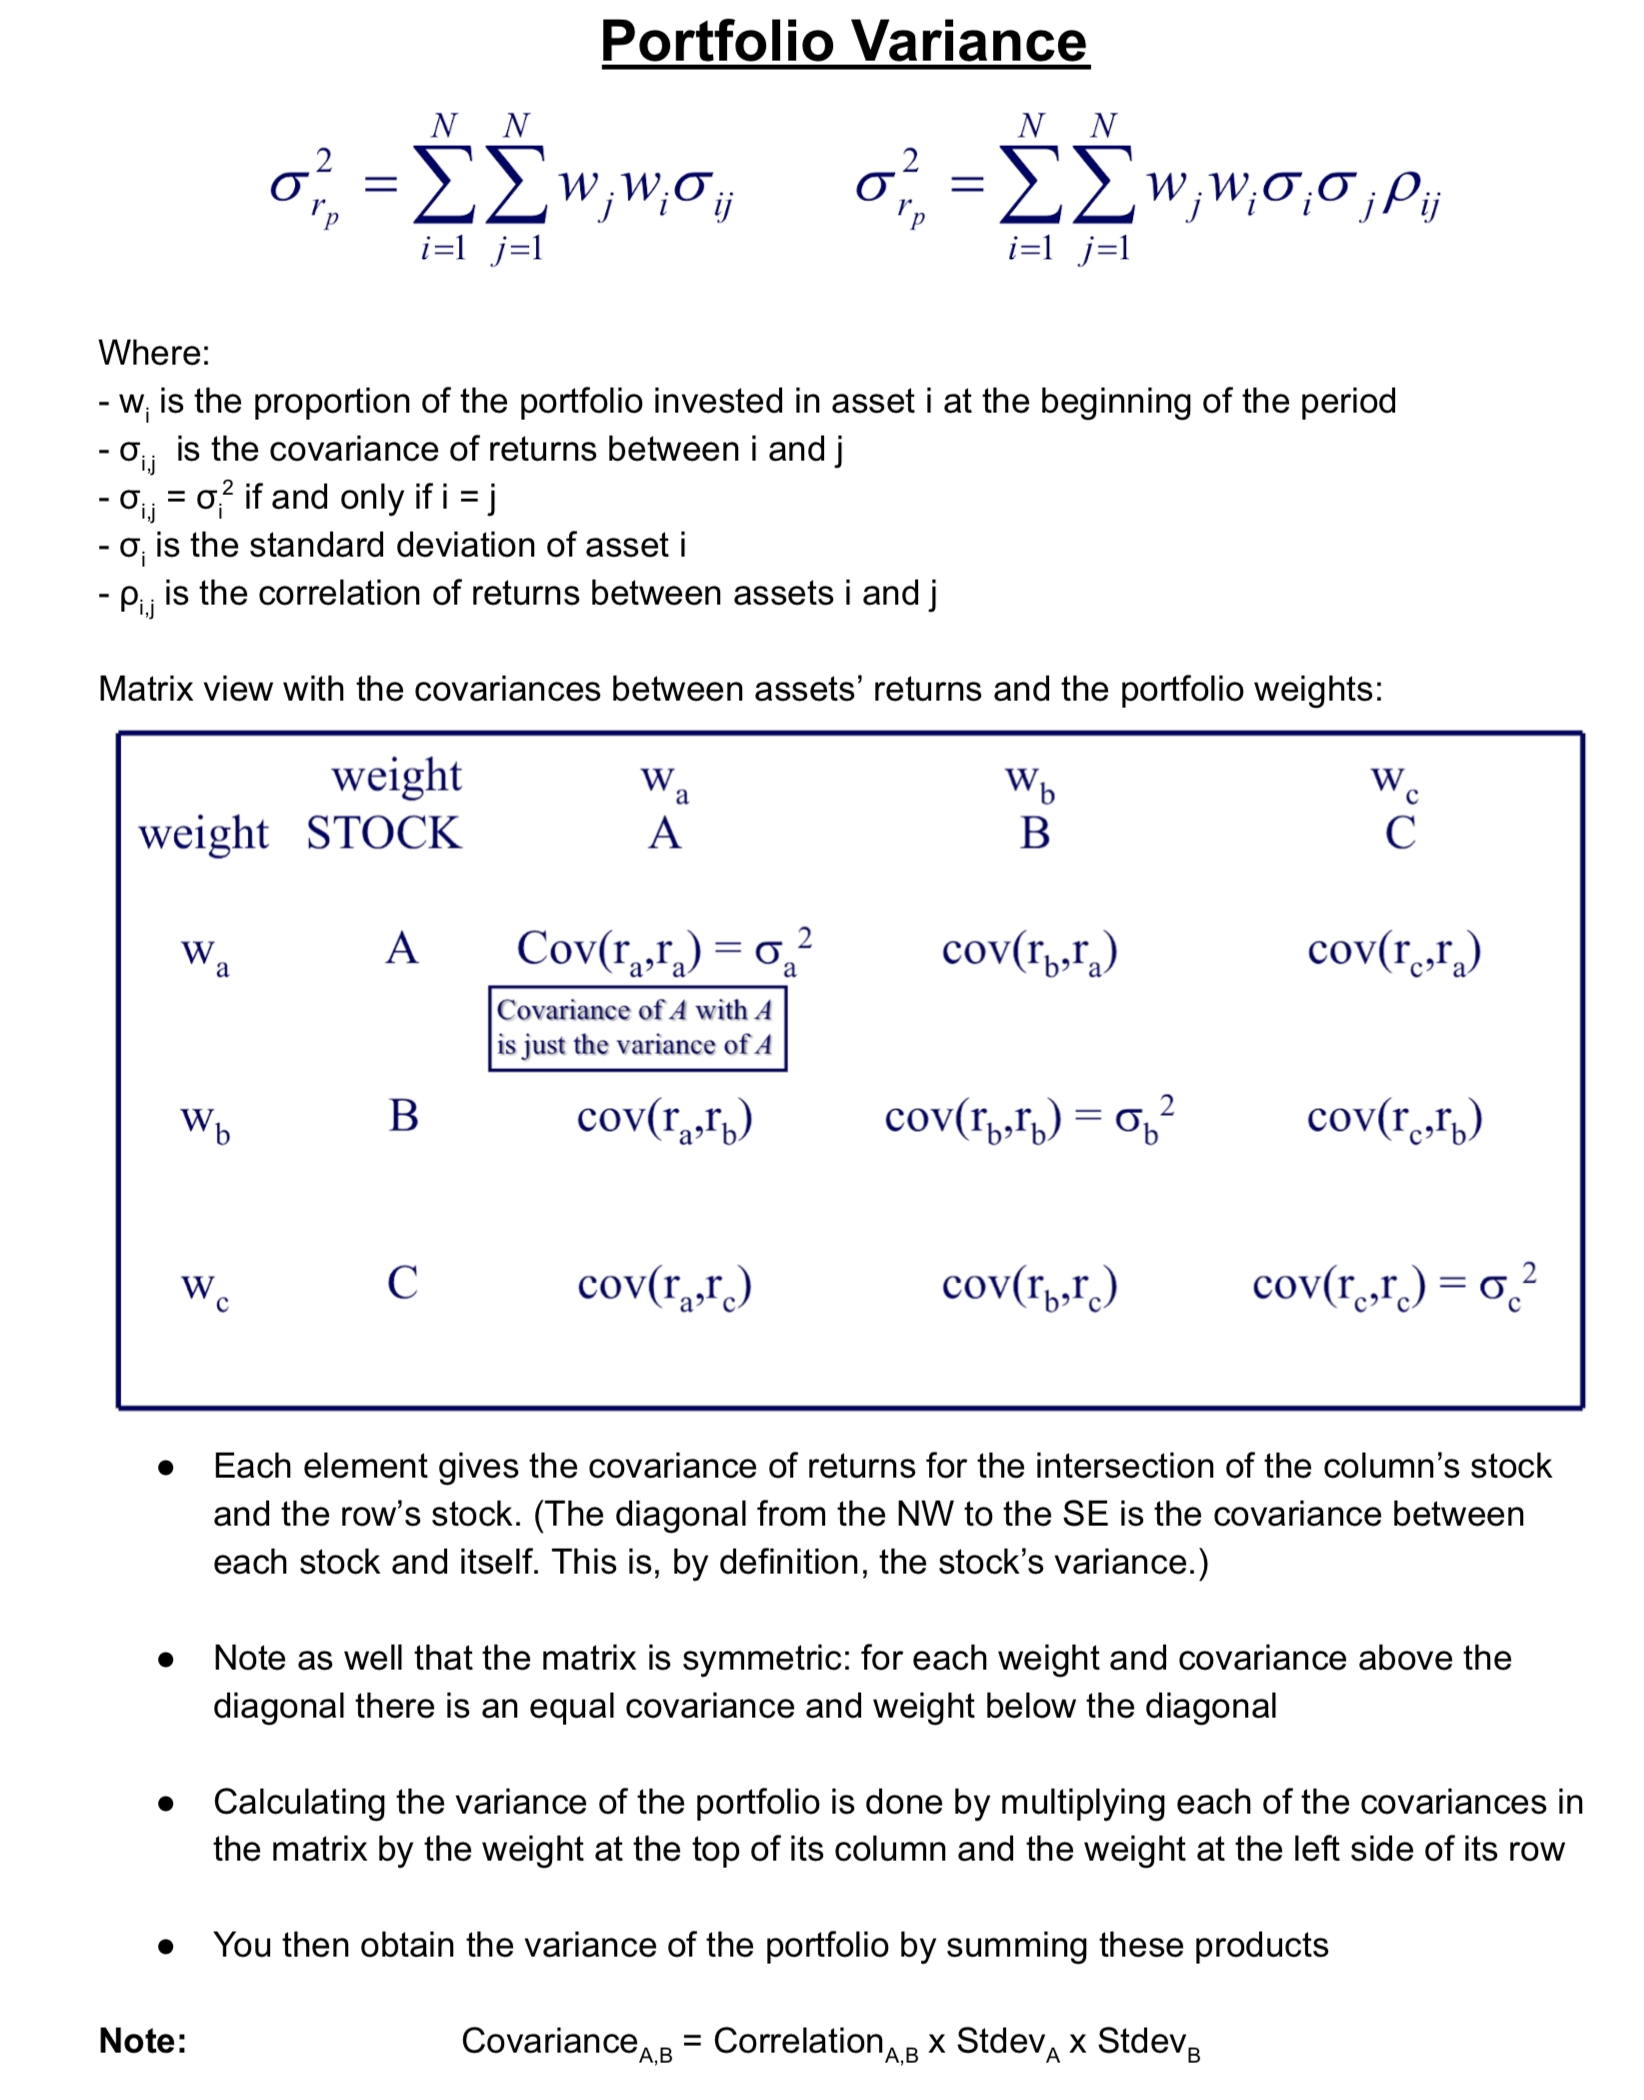
Portfolio Variance is calculated as follows: